

US government bond yields declined as investors sought safe havens in the bond market amid strong pressures on stock futures following indications of major Democratic electoral victories in the US midterms. Political uncertainty and potential shifts in parliamentary balances triggered market turbulence, with investors paring back their exposure to equities and rotating toward US Treasuries.
Decline in US bond yields
The yield on the benchmark 10-year US Treasury fell by nearly 5 basis points to 4.902%. The 30-year bond yield dropped to 5.291%, recording a decline of 5.29 basis points, while the 2-year yield slipped by 6 basis points to 4.55%.
The picture in the US Treasury market was as follows:
-
10-year US bond: 4.90%, down 0.05 percentage points.
-
1-month US bond: 3.95%, up 0.007.
-
1-year US bond: 4.385%, down 0.009.
-
2-year US bond: 4.556%, down 0.058.
-
30-year US bond: 5.291%, down 0.033.
-
3-month US bond: 4.136%, up 0.005.
-
6-month US bond: 4.285%, down 0.005.
 Democrats capture the House – Uncertainty over the Senate
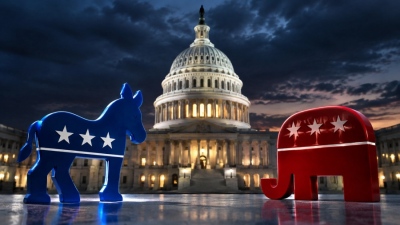
On the political front, Democrats are projected to win the House of Representatives, while probabilities for capturing the Senate are also rising. Potential Democratic victories and the prospect of shifting political balances in Washington constituted a key source of concern for investors, who reassessed their positions amid electoral uncertainty.
Heavy pressure on Wall Street futures – Tech stocks in the red
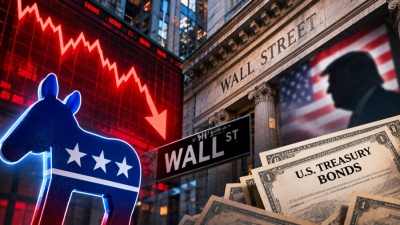
US stock index futures recorded heavy losses as election results began to roll in. S&P 500 futures fell 1.1%, while Nasdaq-100 contracts dropped 2%. Pressures were particularly intense on artificial intelligence (AI) stocks, which had spearheaded the upward trajectory of the US equity market. These specific equities found themselves at the epicenter of overnight liquidations as fears grew that a stronger Democratic presence in Congress could slow down the expansion of data center investments. The market thus reacted to political developments, with technology stocks sustaining the heaviest pressure while US government bonds attracted capital seeking greater safety, directly impacting Wall Street election futures.
What Wall Street history shows
Despite today's picture, historical experience indicates that this specific electoral contest bodes well for equities, regardless of the outcome. The S&P 500 index displays a tendency to post positive performances following both midterm and presidential elections. According to a CNBC analysis of index returns following electoral contests from 1980 to 2024, the S&P 500 gained an average of 0.2% one day and one week after elections, while one month later it recorded an average rise of 1.1%. These figures encompass both presidential and midterm elections. On a one-year horizon, the index registered an average advance of 13.7% after midterm elections and 13.8% after presidential elections. Returns were positive in 91% of cases. Indeed, the S&P 500 closed with gains after all 11 midterm elections from 1982 to 2022. Short-term returns, however, were less reliable, particularly after presidential elections, which exhibited slightly negative average returns one day and one week post-voting. "There is some anxiety heading into these elections. Once they are completed, however, immense relief takes over and markets tend to perform quite well," Ryan Detrick, network contributor and chief market strategist at Carson Group, told CNBC, defining post-midterm market trends.
Markets prefer political gridlock in Washington
Despite the positive historical picture, markets typically prefer a divided political landscape in which one party controls the White House and the other holds control of at least one of the two chambers of Congress. In the 10 midterm and five presidential elections that did not result in unified party control, the S&P 500 recorded an average gain of 15% over a one-year period. Returns were positive in 14 out of 15 cases. Conversely, in elections leading to full single-party control, the index advanced by an average of 11.5% over the following year. "If a massive red wave occurs in favor of Republicans or a major blue wave in favor of Democrats, markets don't particularly favor it because it implies excessive spending in one direction and an over-concentration of power," Detrick explained, highlighting divided government market reactions.
The Democratic Congress scenario and Trump's role
Democratic control of Congress with a Republican in the White House also constitutes a historically positive scenario. CNBC analysis showed that in the three midterm election cycles of 1986, 1990, and 2006—when Democrats controlled both chambers of Congress and a Republican held the presidency—the S&P 500 dipped by an average of 0.5% on the initial day of market reaction. However, one month later it had advanced by 3.4%, while on a one-year horizon it recorded a 10.9% gain. Naturally, elections may simply coincide chronologically with other factors carrying far greater weight for stock market direction. A characteristic example occurred in 2000, when the S&P 500 collapsed by 22.1% in the year following the election due to the bursting of the dot-com bubble, representing the worst post-election performance since 1980. On the flip side, the strongest annual post-election performance was recorded after the 2020 contest, when the S&P 500 surged 38.3% as markets executed an impressive recovery following the crash caused by the COVID-19 pandemic, illustrating S&P 500 historical election data.
The Fed and corporate earnings matter more than elections
Investors should keep in mind that Federal Reserve policy and the corporate earnings cycle ultimately hold greater significance for markets than the election outcome, according to Société Générale. Indicatively, equities declined following the 2018 midterm elections when Democrats regained control of the House of Representatives during Donald Trump's first presidential term. However, the most critical factor was monetary policy tightening by the Fed, which raised interest rates four times during that specific year. As a result, the S&P 500 completed 2018 with losses of 6.2%, although one year after the elections the market had gained 11.7%, shaping Federal Reserve rate impact.
Artificial intelligence is the major catalyst – Risk to infrastructure investments
The most important factor capable of altering market trajectory right now is artificial intelligence and whether pressure on tech stocks will persist. As long as the AI wave remains strong and the economy continues to expand, "the bull market likely remains alive and well," Detrick estimates. However, a sweeping Democratic victory in both the House of Representatives and the Senate would almost certainly exert pressure on AI infrastructure development and could lead to further curtailment of relevant capital expenditure. At the same time, the bond market also appears nervous as yields rise internationally and France faces a mini-debt crisis. Furthermore, the war with Iran may escalate post-election if President Donald Trump executes his threats of new attacks or if Tehran proceeds with further escalation. "Seasonality is not destiny, and concerns surrounding Iran, AI, and France are not going to magically vanish," Jim Reid, head of global fundamental credit and thematic research at Deutsche Bank, noted in a report, outlining AI infrastructure capex risks.
The prospect of a Santa rally – But risks remain
If history repeats itself, markets could register a strong Christmas rally (Santa rally), with the S&P 500 strengthening following the midterms. However, today's market continues to be driven to a large extent by artificial intelligence, while geopolitical developments, the Federal Reserve, and the bond market maintain a decisive role in shaping investment direction, influencing year-end stock market rally.
www.bankingnews.gr











Σχόλια αναγνωστών